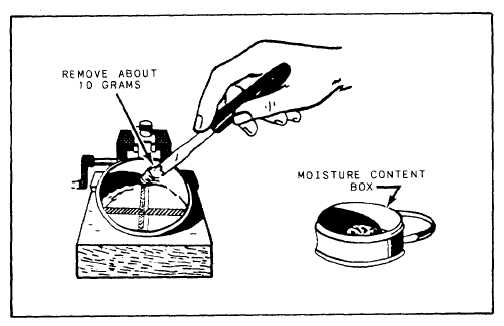
Figure 15-36.-Removing sample portion for moisture content.
the groove (fig. 15-36). Place this in a mois-
ture content can, weigh it, and record the
weight. Oven-dry and record the difference
in weights. This is the weight of the water
content.
4. Transfer the remaining soil in the cup to
the evaporation dish. Wash and dry the cup and
grooving tool. Reattach the cup in preparation for
the next run.
5. Run at least five tests on each soil, with two
closures above, two closures below, and one
closure at or near the 25-blow line. An ideal
spread is closures at 16, 23.5, 29, and 33 blows.
If each testis perfect, the plotted line through all
points is shown as a straight line. If some tests
are imperfect, the operator can usually get good
results by using the three plotted points lying most
nearly in a straight line.
To determine the liquid limit, plot a FLOW
CURVE on a graph like the one shown in figure
15-37. It is a semilogarithmic graph, in which the
vertical coordinates are water content and the
horizontal coordinates are number of blows. The
flow curve is a straight line plotted as nearly as
possible through three or more of the plotted
points.
In figure 15-37, the first-run sample was tested
three times for an average number of 16 hammer
blows. The water content was 47.3 percent. On
the graph, 16 and 47.3 are the coordinates of one
of the three Xs shown plotted. The second-run
sample indicated 24 hammer blows and 46.6
percent water content; these are the coordinates
of another of the Xs plotted to the right. Coor-
dinates for the third X are the hammer blows and
water content for the third-run sample. The coor-
dinates of the rest of the plotted points are as in-
dicated by the hammer blows and water content
for the succeeding runs. The plotted points in the
graph may not form a straight line; however, the
liquid limit line (or flow curve) is a straight line,
passing nearly through the mean of the plotted
points (fig. 15-37). The usual recommendation is
that five or six trials be made so that the results
are more representative.
The liquid limit (LL) is the water content for
25 blows; it is therefore indicated by the point of
intersection between the flow curve and the ver-
tical line representing 25 blows. The water con-
tent indicated is about 46.4 percent. This, when
rounded off to 46, is the liquid limit.
The plastic limit of soil is the lowest water con-
tent at which the soil just begins to crumble when
rolled into threads 1/8 in. in diameter, at slowly
decreasing water content. First, prepare the
sample as follows:
If you need only the plastic limit, take
a quantity of soil weighing about 15 g from
the prepared material in the evaporating dish.
Place this air-dried soil in an evaporating
15-32