The total weight of fractions plus the weight
of the material that reached the pan comes to
359.0 g. The weight of the sample originally was
359.1 g; there is an error here of 0.1 g. At the
lower right, you can see how the percentage of
error is computed. The maximum permissible
percentage of error is normally (±) 1 percent. If
the percentage exceeds the maximum, the test
must be rerun. For an error smaller than the max-
imum permissible, correction is made by adding
the value of the error to the largest amount listed
as retained. The value of the error in this case is
0.1 g. The largest amount retained is 83.3 g for
the No. 20 sieve. This amount would be changed
to 83.4 g.
SIEVE ANALYSIS WITH PREWASH-
ING.— When inspection indicates that a sample
contains an excessively high portion of superfine
material (material that passes the No. 200 sieve),
analysis with prewashing is done as follows:
1. Oven-dry the sample.
2. Weigh and record the total weight after
cooling.
3. Place the sample in a clean pan and add
clean water until it is completely covered. Allow
it to soak until it is completely disintegrated—
from 2 to 12 hr. Stir to break up lumps and hasten
the action.
4. Wash the material thoroughly on a No. 200
sieve under running water and discard the material
that passes.
5. Oven-dry and reweigh. Record the dif-
ference between this weight and the original
weight as washing loss.
6. Continue as for sieve analysis, dry.
Figure 15-32 shows a data sheet for sieve
analysis with prewashing. The ovendry weight of
the original sample was 75.0 g; the ovendry weight
after prewashing was 55.0 g; therefore, the
washing loss was 75.0 -55.0 or 20.0 g. The sum
of the weights retained (53.0 g, the total of col-
umn b) plus the 2.0 g that, in spite of prewashing,
was still left in the sample to pass the No. 200
sieve, equals 55.0 g. This was the original weight
after prewashing. Therefore, no error was made.
Hydrometer Analysis
As you learned in the preceding discussion, the
determination of grain size distribution by sieve
analysis is limited to those materials larger than
the No. 200 (0.074-mm) sieve. For uses such as soil
classification, this is sufficient since grain size
distribution is not used to classify fine-grained
soils. For determination of frost susceptibility,
however, the distribution of particles smaller than
the No. 200 sieve is necessary. A soil is considered
frost susceptible if it contains 3 percent or more
by weight of particles smaller than 0.020 mm in
diameter. Frost susceptibility should always be
considered in areas subject to substantially
freezing temperatures, since repeated freezing,
and subsequent thawing, of water in the soil can
seriously affect the ability of the soil to support
a structure. Hydrometer analysis is the test used
to determine the grain size distribution of the soils
passing the No. 200 sieve.
Hydrometer analysis is based on Stokes’ law,
which relates the terminal velocity of a free-falling
sphere in a liquid to its diameter. The relation is
expressed by the following equation.
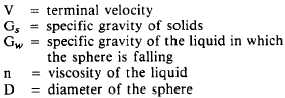
Where:
It is assumed that Stokes’ law can be applied
to a mass of dispersed soil particles of various
shapes and sizes. Larger particles settle more
rapidly than the smaller ones. The hydrometer
analysis is an application of Stokes’ law that per-
mits the calculation of the grain size distribution
in silts and clays, where the soil particles are given
the sizes of equivalent spherical particles.
The density of a soil-water suspension depends
upon the concentration and specific gravity of the
soil particles. If the suspension is allowed to stand,
the particles will gradually settle out of the suspen-
sion, and the density will be decreased. The
hydrometer is the instrument used to measure the
density of the suspension at a known depth below
the surface. The density measurement, together
with knowledge of specific gravity of the soil
particles, determines the percentage of dispersed
soil particles in suspension at the time and depth
of measurement. Stokes’ law is used to calculate
the maximum equivalent particle diameter for the
material in suspension at this depth and for the
elapsed time of settlement. A series of density
measurements at known depth of suspension and
at known times of settlement gives the percentages
of particles finer than the diameters given by
Stokes’ law. Thus the series of readings will reflect
the amount of different sizes of particles in the
fine-grained soils. The particle diameter (D) is
15-24