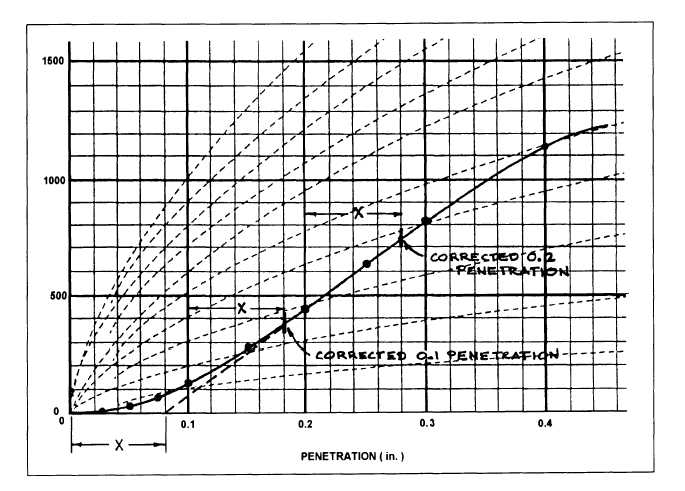
Figure 13-12.—Adjusting the zero point of the curve.
indicates that the proving-ring dial used for this test
necessary to obtain the true or corrected load. In this
contained a previously determined index error of 0.003
inch. An error of this kind develops as a result of
repeated compressions of the proving ring during
testing.
The figures under total load are the results obtained
by multiplying the corrected dial reading by the
proving-ring constant. Each unit load was obtained by
dividing the total load by 3.
Figure 13-11B is the reverse side of the CBR test
data sheet. This side of the data sheet is used to plot the
unit loads against the penetration depths to determine if
a correction to the unit load is necessary.
In figure 13-11B you see the curve for sample
SF-PI-4 that we have been discussing. The convex shape
of this curve indicates that no corrections were
necessary. Sometimes, however, surface irregularities in
the soil sample or disturbances during the test will result
in curves having an initially concave shape, such as
shown in figure 13-11B for samples SF-PI-5 and
SF-PI-6. This shape indicates that a correction is
case, you must first adjust the zero point of the curve.
Figure 13-12 illustrates the procedure you should use to
adjust the zero point. First, draw a line that is tangent to
the steepest portion of the concave curve and extend the
tangent to the zero base line. The point of intersection
of the tangent and the base line is the new
zero-penetration point. The distance of the new zero
point from the original zero point (distance X) is the
distance that the 0.1 and 0.2 points are moved to the right
to establish the corrected unit load.
Finally, let’s look again at figure 13-11A and discuss
how the CBR values are determined. To compute the
CBR values, you divide the unit load (or corrected unit
load) at 0.1 and 0.2 inch by the standard unit loads of
1,000 and 1,500 psi, respectively. Each result is then
multiplied by 100 to obtain the CBR in percent. The
CBR is usually selected at 0.1 inch; however, when the
CBR at 0.2 inch is greater, you should first rerun the test
and then if the check tests give similar results at 0.2-inch
penetration, the CBR at 0.2 inch should be used.
13-15