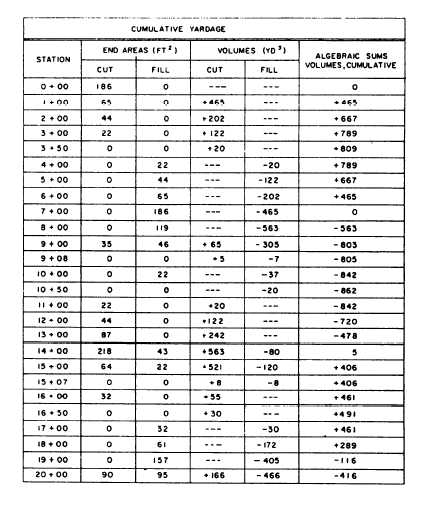
Tabulating Cumulative Yardage.— The first
step in making a mass diagram is to prepare a table of
cumulative yardage, like the one shown in table 10-2.
Under End Areas, you put the cross-sectional area at
each station—sometimes this is cut, sometimes fill,
and sometimes (as at stations 9 + 00 and 15 + 00) part
cut and part fill. Under Volumes, you put the volumes
of cut or fill between stations, computed from the
average end areas and the distance between sections
in cubic yards. Note that, besides the sections at each
full station, sections are taken at every plus where both
the cut and the fill are zero. Note also that cut volumes
are designated as plus and fill volumes as minus.
Under Algebraic Sums Volumes, Cumulative,
you put the cumulative volume at each station and
each plus, computed, in each case, by determining the
algebraic sum of the volume at that station or plus and
the preceding cumulative total; for example, at station
8 + 00 the cumulative total is –563. At station 9 + 00
there is a volume of cut of +65 and a volume of fill of
–305, making a net of –240. The cumulative total at
station 9 + 00, then, is (–563)+ (–240), or –803.
Plotting Mass Diagram.— Figure 10-10 shows
the values from the table of cumulative yardage
plotted on a mass diagram. The vertical coordinates
are cumulative volumes, plus or minus, from a line of
zero yardage, each horizontal line representing an
increment of 200 cubic yards. The horizontal
coordinates are the stations, each vertical line
representing a full 100-foot station.
As you can see, the mass diagram makes it
possible for you to determine by inspection the
yardage of cut or fill lying between any pair of
stations. Between station 0 + 00 and station 3 + 50, for
example, there are about 800 cubic yards of cut.
Between station 3 + 50 and station 7 + 00, there are
about 800 cubic yards of fill (descending curve).
Between station 7 + 00 and station 10 + 50, there are
about 850 cubic yards of fill (curve still descending),
and so on.
Table 10-2.—Table of Cumulative Yardage
10-12