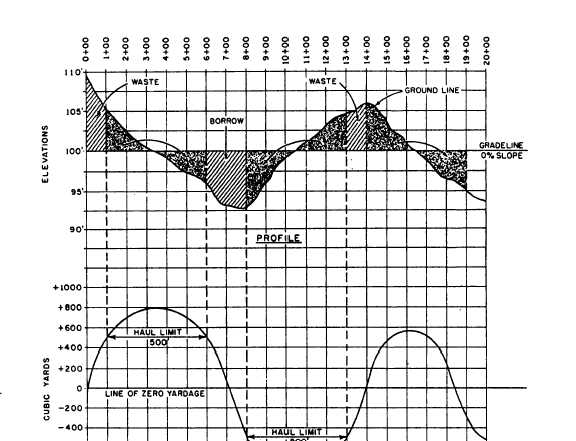
Figure 10-10.—Profile and mass diagram.
Remember that sections where the volume
(yardage) changes from cut to fill correspond to a
maximum in the mass diagram curve, and sections
where it changes from fill to cut correspond to a
minimum. The peaks and the lowest points of the mass
diagram that represent the maximum or minimum
yardage, occur at, or near, the grade line on the profile.
Balancing Cuts and Fills.— To understand the
manner in which the mass diagram is used to balance
cuts and fills and how haul limit is determined, let’s
examine figure 10-10. Here the profile of a road, from
stations 0 + 00 to 20 + 00, has been plotted above the
mass diagram. You can see that they are plotted on the
same horizontal scale. The labeled sections and arrows
on the profile show relatively what is to be done to the
cuts and fills; and where the limit of economical haul
is exceeded, the cut is wasted, and the fill is borrowed.
In figure 10-10, a 500-foot haul-limit line has been
inserted into the mass diagram curve above and below
the lines of zero yardage. (The 500-foot distance is
laid out to scale horizontally parallel to the line of zero
yardage.) The terminal points of these haul-limit
distances were projected to the profile curve, as
indicated. You can see that the cut lying between
stations 1 + 00 and 3 + 50 can be hauled economically
as far as station 6 + 00; that lying between stations 10
+ 50 and 13 + 00, as far as station 8 + 00; and that lying
between stations 14 + 00 and 16 + 50, as far as station
19 + 00. This leaves the cut between stations 0 + 00
and 1 + 00, the fill between stations 6 + 00 and 8 + 00,
the cut between stations 13 + 00 and 14 + 00, and the
fill between stations 19 + 00 and 20 + 00.
As indicated in figure 10-10, the cut between
stations 0 + 00 and 1 + 00, lying outside the limit of
economical haul distance, would be wasted; that is,
dumped into a nearby spoil area or ravine. The cut
10-13