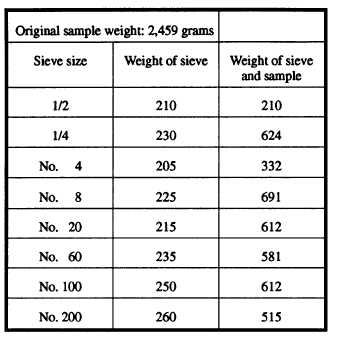
Figure 16-9.—Sieve analysis data.
Q2.
Q3.
Q4.
Is it true or false that surveys made in support of
pedology concern the locations of the limits of
sand or gravel deposits suitable for use as
construction materials?
Structures must be constructed at an elevation
that will ensure that they will not be adversely
affected by the groundwater table. If the
proposed grade line lies below the elevation of
the groundwater line, you may have to
1. change the location
2. lower the groundwater table by means of
artificial drainage systems
3. raise the proposed grade
4. do either 2 or 3 above, depending upon land
characteristics
From the sieve analysis data shown in figure
16-9, determine and plot the grain size
distribution using figure 16-10. For this soil
Figure 16-10.—Grain size distribution graph.
16-21