of the plasticity chart (for example, LL 20 and PI 5), the
soil is designated either SW-SC or SW-SM; it depends
on the judgment of the engineer from the standpoint of
the climatic region in which the soil is located.
FINE-GRAINED SOILS
The fine-grained soils are not classified on the basis
of grain size distribution, but according to plasticity and
compressibility. Laboratory classification criteria are
based on the relationship between the liquid limit and
plasticity index as designated in the plasticity chart in
figure 16-3. This chart was established by the deter-
mination of limits for many soils, together with an
analysis of the effect of limits upon physical
characteristics.
Examination of the chart shows that there are two
major groupings of fine-grained soils. Thase are the L
groups, which have liquid limits less than 50, and the H
groups, which have liquid limits equal to and greater
than 50. The symbols L and H have general meanings
of low and high compressibility, respectively.
Fine-grained soils are further divided with relation to
their position above or below the A-line of the plasticity
chart.
ML and MH Groups
Typical soils of the ML and MH groups are
inorganic silts. Those of low compressibility are in the
ML group. Others are in the MH group. All of these soils
plot below the A-line of the plasticity chart. The ML
group includes very fine sands, rock flours (rock dust),
and silty or clayey fine sand or clayey silts with low
plasticity. Loess type soils usually fall into this group.
Diatomaceous and micaceous soils usually fall into the
MH group but may fall into the ML group when the
liquid limit is less than 50. Plastic silts fall into the MH
group.
and
CL and CH Groups
In these groups, the symbol C stands for clay, with
L and H denoting low or high liquid limits. These soils
plot above the A-line and are principally inorganic clays.
In the CL group are included gravelly clays, sandy clays,
silty clays, and lean clays. In the CH group are inorganic
clays of high plasticity.
OL and OH Groups
The soils in these two groups are characterized by
the presence of organic matter; hence the symbol O. All
of these soils generally plot below the A-line. Organic
silts and organic silt-clays of high plasticity fall into the
OL group, while organic clays of high plasticity plot in
the OH zone of the plasticity chart. Many of the organic
silts, silt-clays, and clays deposited by the rivers along
the lower reaches of the Atlantic seaboard have liquid
limits above 40 and plot below the A-line. Peaty soils
may have liquid limits of several hundred percent and
plot well below the A-line because of their high
percentage of decomposed vegetational matter. A liquid
limit test, however, is not a true indicator in cases in
which a considerable portion consists of other than soil
matter.
Borderline Soils
Fine-grained soils that have limits that plot in the
shaded portion of the plasticity chart are borderline
cases and are given dual symbols, such as CL-ML.
Several soil types that exhibit low plasticity plot in this
general region on the chart where no definite boundary
between silty and clayey soils exists.
HIGHLY ORGANIC SOILS
A special classification (Pt) is reserved for the
highly organic soils, such as peat, which have
characteristics that are undesirable for construction
materials and foundations. No laboratory criteria are
established for these soils, as they generally can be
readily identified in the field by their distinctive color
and odor, spongy feel, and fiequently, fibrous textures.
Particles of leaves, grass, branches, or other fibrous
vegetable matter are common components of these
soils.
COEFFICIENT OF UNIFORMITY
In table AV-1 of appendix V, you can see that
well-graded gravels (GW) and well-graded sands (SW)
must meet certain requirements with regard to
means the coefficient of uniformity with regard
to the plotted grain size curve for the material. To see
how the coefficient of uniformity is determined, let’s
consider an example.
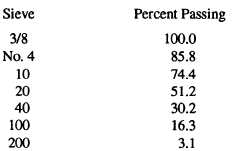
Suppose that the sieve analysis of a soil sample
identified as FT-P1-1 is as follows:
16-13


