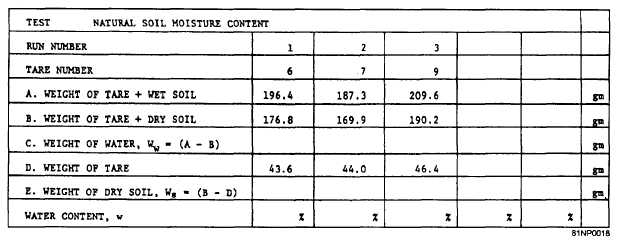
Figure 13A
IN ANSWERING QUESTIONS 13-34 THROUGH
13-38.
13-37, REFER TO FIGURE 13A WHICH IS A
TABLE OF VALUES FOR THREE MOISTURE CONTENT
TESTS ON A TYPICAL SOIL SAMPLE.
COMPUTE
THE WATER CONTENT OF EACH RUN.
13-34.
What is the dry weight of the soil
in run number 1?
1.
176.8 g
2.
152.8 g
3.
143.6 g
4.
133.2 g
13-35.
What is the weight of water in run
number 2?
1.
17.4 g
2.
17.6 g
3.
18.4 g
4.
18.6 g
13-36.
What is the water content of
run number 3?
1.
13.0%
2.
13.2%
3.
13.5%
4.
17.4%
13-37.
What is the average moisture
content of the three runs?
The results of a sieve analysis
shows 100% passing the
1 3/4-, 1x-, and Ilk-inch sieves
and 99% passing the l-inch sieve.
What should be the first sieve
size entered on the data sheet?
1.
1
2.
13
3.
1%
4.
1 3/4
THIS SPACE INTENTIONALLY LEFT BLANK
1.
13.4%
2.
14.0%
3.
31.1%
4.
41.9%
91

