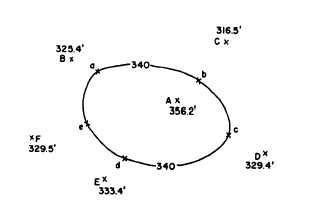
Figure 8-15.-Control-point method of locating contour.
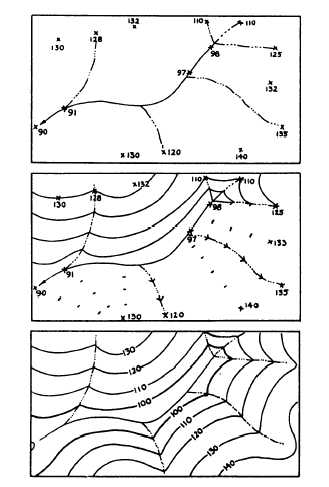
Figure 8-16.-Sketching contours by interpolation between
control points of known elevations.
elevation changes radically), you can draw a contour
map of the area by interpolating the desired contours
between the control points.
A very elementary application of the method is
shown in figure 8-15. Point A is the summit of a more
or less conical hill. A spot elevation is taken here. Spot
elevations are also taken at points B, C, D, E, and F,
8-15
Figure 8-17.-Cross profiles.
which are points at the foot of the hill. It is desired to
draw the 340.0-foot contour. Point a on the contour line
is interpolated on the line from A to B, point b is
interpolated on the line from A to C, point c is
interpolated on the line from A to D, and soon.
Figure 8-16 shows a more complicated example in
which contours are interpolated and sketched between
controlling spot elevations taken along a stream.
Cross Refiles
In the cross-profile system, elevations are taken
along selected lines that are at right angles to a traverse
line. Shots are taken at regular intervals or at breaks or
both in the ground slope. The method is illustrated in
figure 8-17. The line AB is a traverse along which
100-foot stations are shown. On each of the dotted
cross-section lines, contours are located. The particular
contour located at a particular station depends on (1) the
ground elevations and (2) the specified contour interval.
In this instance, it is 2 feet. The method used to locate
the contours is the one described earlier for tracing a
contour system. When the even-numbered 2-foot
interval contours are located on all the cross-profiles
lines, the contour lines are drawn through the points of
equal elevation.