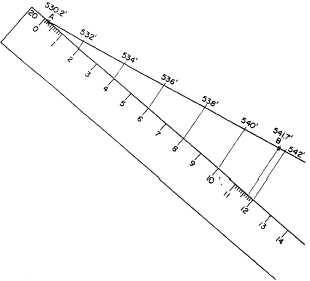
Figure 8-32.—Interpolating contour lines with a scale.
between 11 and 12 feet. Select the scale on the
engineer’s scale that has 12 graduations for a distance
and comes close to matching the distance between A and
B on the map. In figure 8-32, this is the 20 scale. Let the
0 mark on the 20 scale represent 530.0 feet. Then the 0.2
mark on the scale will represent 530.2 feet, the elevation
of A. Place this mark on A, as shown.
If the 0 mark on the scale represents 530.0 feet, then
the 11.7 mark represents
530.0 + 11.7, or 541.7 feet,
the elevation of B. Place the scale at a convenient angle
to the line from A to B, as shown, and draw a line from
the 11.7 mark to B. You can now project the desired
contour line locations from the scale to the line from A
to B by drawing lines from the appropriate scale
graduations (2, 4, 6, and so on) parallel to the line from
the 11.7 mark to B.
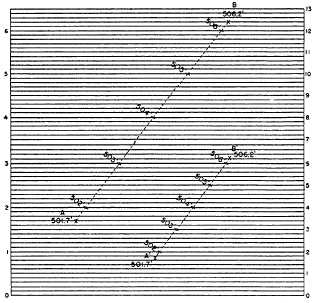
Figure 8-33 shows a graphic method of
interpolating contour lines. On a transparent sheet, draw
a succession of equidistant parallel lines. Number the
lines as shown in the left margin. The 10th line is number
1; the 20th, number 2, and so on. Then the interval
between each pair of adjacent lines represents 0.1 feet.
Figure 8-33 shows how you can use this sheet to
interpolate contour lines at a 1-foot interval between
point A and point B. Place the sheet on the map so that
the line representing 1.7 feet (elevation of A is
500.0 + 1.7, or 501.7 feet) is on A, and the line
representing 6.2 feet (elevation of B is 500.0 + 1.7, or
506.2 feet) is on B. You can see how you can then locate
the l-foot contours between A and B.
Figure 8-33.—Graphic method of interpolating contour lines.
For a steeper slope, the contour lines would be
closer together. If the contour lines were too close, you
might find it advisable to give the numbers on the
graphic sheet different values, as indicated by the
numerals in the right-hand margin. Here the space
between each pair of lines represents not 0.1 foot, but
0.2 foot. Points A´ and B´ have the same elevations as
points A and B, but the fact that the horizontal distance
between them is much shorter shows that the slope
between them is much steeper. You can see how the
1-foot contours between A´ and B´ can be located, using
the line values shown in the right margin.
A third method of rapid interpolation involves the
use of a rubber band, marked with the correct, equal
decimal intervals. The band is stretched to
correct graduations on the points.
GENERAL REQUIREMENTS FOR
TOPOGRAPHIC MAPS
bring the
The scale and contour interval of a map that you are
preparing will be specified according to the purpose for
which the map will be used. Obviously, a map that will
be used for rough design planning of a rural dirt road
will be on a smaller scale and have a larger contour
interval than one to be used by builders to erect a
structure on a small tract in a built-up area.
The extent to which details must be shown may also
be specified; if not, it is usually inferred from the
8-23


