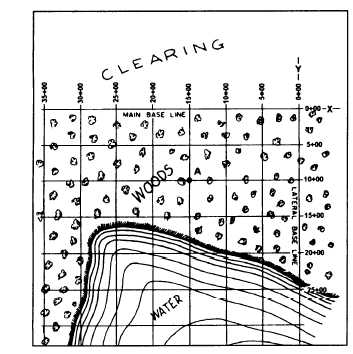
Referring to figure 9-10, suppose that this site has
been chosen (through reconnaissance) for an ad-
vanced base with airstrip facilities. As you see in
figure 9-10, there is a sheltered water area for a poten-
tial harbor; a strip of woodland extending back from
the shore; and then a strip of clear, level country where
an airstrip could be constructed.
Although topographic data for a map of this area
could be obtained by one field party, it would involve
extensive time and effort. Therefore, let’s assume that
three field parties will be used. Two of these parties
are transit-level parties since they will use either tran-
sits or levels as appropriate to the work performed.
The third party is a plane-table party. The plane-table
party will work in the clear area and the transit-level
parties will operate in the wooded and the water areas.
Basic horizontal control for both the plane-table
party and the transit-level parties is the main base
line, which is run along the edge of the wooded area
as shown in figure 9-10. Topographic details in the
clearing will be plotted from plane-table stations tied
to the main base line. Details in the wooded area and
offshore will be plotted from stations on a grid net-
work that is tied to the main base line.
The grid network can be established in the
following manner: transit-level party No. 1 runs the
main base line from station 0 + 00, located at random.
I
While running the main base line, hubs are set along
Figure 9-10.—Advanced base site.
the line at predetermined intervals; in this case, at
every 500-foot station. Transit-level party No. 2 runs
a lateral base line from 0 + 00 perpendicular to the
main base line and sets hubs at every 500-foot station.
From every 500-foot station on the main base line,
party No. 1 will run a lateral, perpendicular to the main
base line. Likewise, from each station on the lateral
base line, party No. 2 will run a longitudinal,
perpendicular to the lateral base line (and therefore
parallel to the main base line). Hubs are driven at the
intersection of each lateral and longitudinal (except in
the water area). As you can see in figure 9-10, it is
these lateral and longitudinal lines that form the grid
net work.
From your previous studies you know that points
within the grid can be located by coordinates, using
the main base line as the X axis and the lateral base
line as the Y axis; for example in terms of stations, the
X coordinate of point A in figure 9-10 is 15 +00 and
the Y coordinate is 10 + 00. For simplicity, these
coordinates can be stated in a fractional form as
1500/1000.
With regard to vertical control for a advance base
site such as we are discussing, there may be no
established bench marks in the immediate area. In this
case, a level net may have to be run from an
established monument some distance away, perhaps
several miles, to establish a bench mark in the area. If
this is not possible, then a series of rod readings should
be taken over a succession of high and low tides or on
the high-water mark wash line along the beach. You
may then use the average of these readings as a
temporary vertical control datum until a more accurate
datum is obtained from tide gauge readings. From a
temporary bench mark at or near the beach, a line of
levels can be run to station 0 + 00 on the main base
line. Temporary elevations of hubs on the main base
line and the lateral base line can then be determined.
Finally, the transit-level parties will shoot the
detail in the vicinity of each of the intersecting grid
lines.
MAP PROJECTION
Now let’s discuss map and chart projection. This
discussion includes the characteristics and
development of various types of projections.
A paper cylinder (without ends) and a paper cone
can be cut along the side and flattened out without
distortion. For this reason, the two most common basic
projection methods are the Mercator, in which the
9-10

