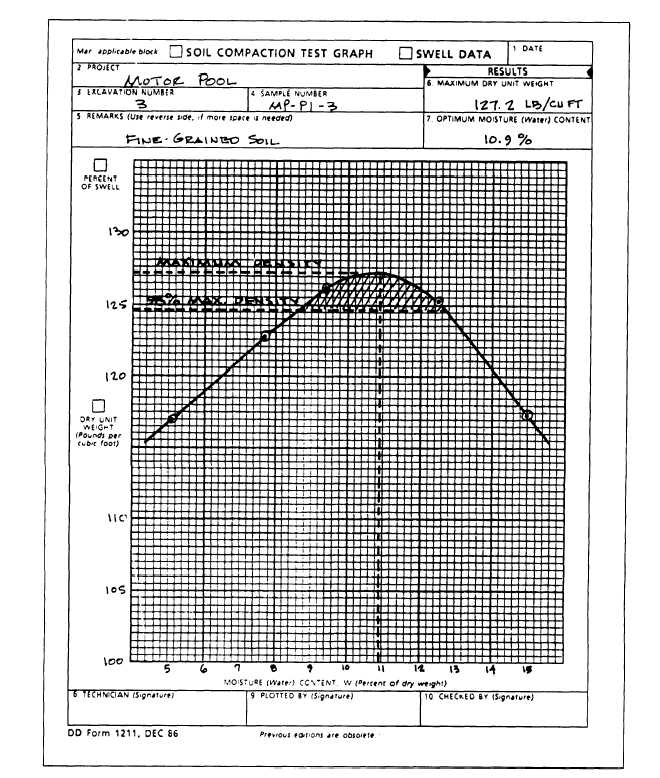
Figure 13-3.—Determination of optimum moisture content.
You determine this by applying the test results to plot a
the curve indicates that the maximum attainable density
curve like the one shown in figure 13-3.
for the given compactive effort was 127.2 pcf for which
In this curve, the horizontal coordinates are the
the OMC was 10.9 percent.
average moisture contents; the vertical coordinates are
The dotted line marked “98% maximum density”
the dry densities. For the test results used in the example,
indicates that, in this case, the project specifications
13-4