Figure 8-19.-Uniform, gentle slope.
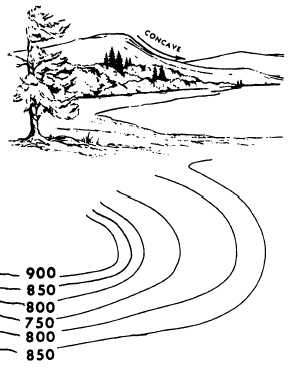
Figure 8-21.-Concave slope.
that appears on the map completely closed may indicate
either a summit or a depression. If the line indicates a
depression, this fact is sometimes shown by a succession
of short hachure lines, drawn perpendicular to the inner
side of the line. An example of a depression is shown in
figure 8-18. A contour line marked in this fashion is
called a depression contour.
On a horizontal or level plane surface, the elevation
of all points on the surface is the same. Therefore, since
different contour lines indicate different elevations,
there can be no contour lines on a level surface. On an
inclined plane surface, contour lines at a given equal
interval will be straight, parallel to each other, and
equidistant.
A number of typical contour formations are shown
in figure 8-18. For purposes of simplification, horizontal
scales are not shown; however, you can see that various
intervals are represented. The arrows shown indicate the
direction of slope.
Generally, the spacing of the contour lines indicates
the nature of the slope. Contour lines (fig. 8-19) that are
evenly spaced and wide apart indicate a uniform, gentle
slope. Contour lines (fig. 8-20) that are evenly spaced
and close together indicate a uniform, steep slope. The
closer the contour lines are to each other, the steeper the
Figure 8-20.-Unifrom, steep slope.
slope. Contour lines closely spaced at the top and widely
spaced at the bottom indicate a concave slope (fig. 8-21).
8-17


